research · 2021
FigureOUT: A Personalized Tool for Summarizing and Visualizing Academic Literature
FigureOUT is a personalized tool for summarizing and visualizing academic literature, helping researchers organize and make sense of papers.
A class project from KAIST ID503 Design Project (Prof. Tak Yeon Lee), by Team 4F. I worked on ideation and front-end development.
Problem: finding the right paper is hard
Whether you’re a novice or an expert, finding the paper is a slog. Search engines return only thin, text-based metadata (title, authors, abstract), which rarely says enough to judge a paper at a glance. And everyone sees the same summary, regardless of their purpose or interest. We wanted a personalized way to summarize and visualize papers so researchers can quickly tell whether something is worth their time.
Solution: visual, personalized paper summaries
FigureOUT summarizes papers visually, in four ways:
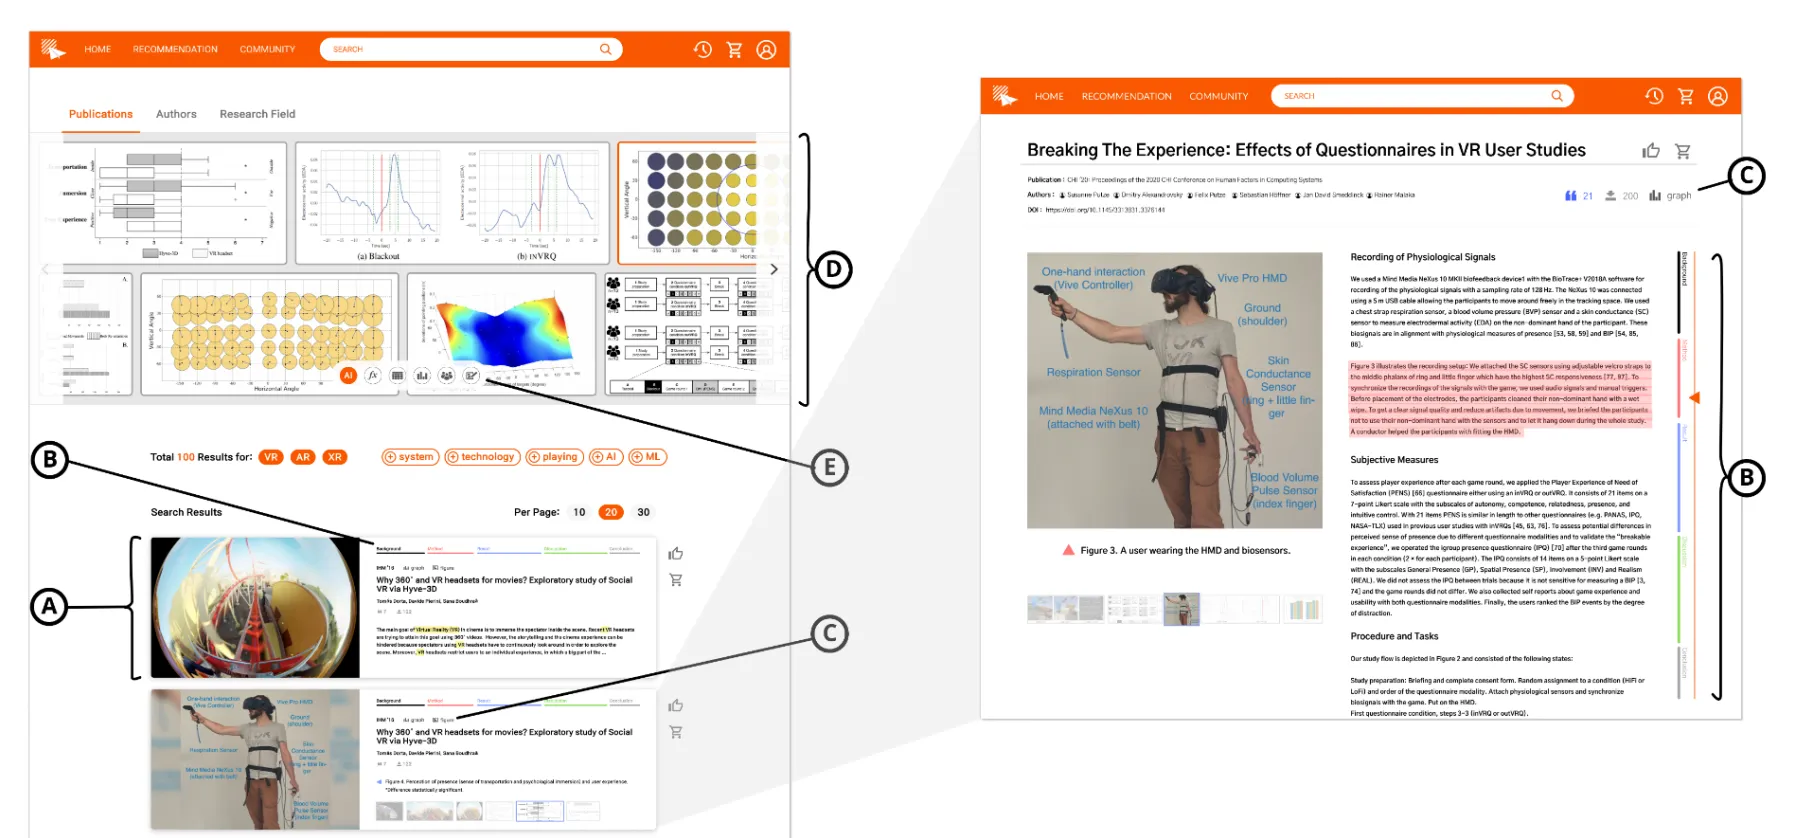
- Figure Cards: search results as cards with thumbnails pulled from each paper.
- Proportion Bar: shows how much space each section takes, so you can guess a paper’s structure without opening the PDF.
- Content Icons: label a paper by its number of graphs, images, and formulas.
- Figure Wall: gathers images from many papers into one frame to compare them and explore vague ideas.
Thumbnail extraction is personalized to each researcher’s real-time search history and stated interests, and a filter lets users switch between an AI-driven and a self-chosen visual summary.
Value
By making relevance visible, FigureOUT saves the time researchers spend hunting and triaging papers, time that can go back into the research itself.